Climate Visualization
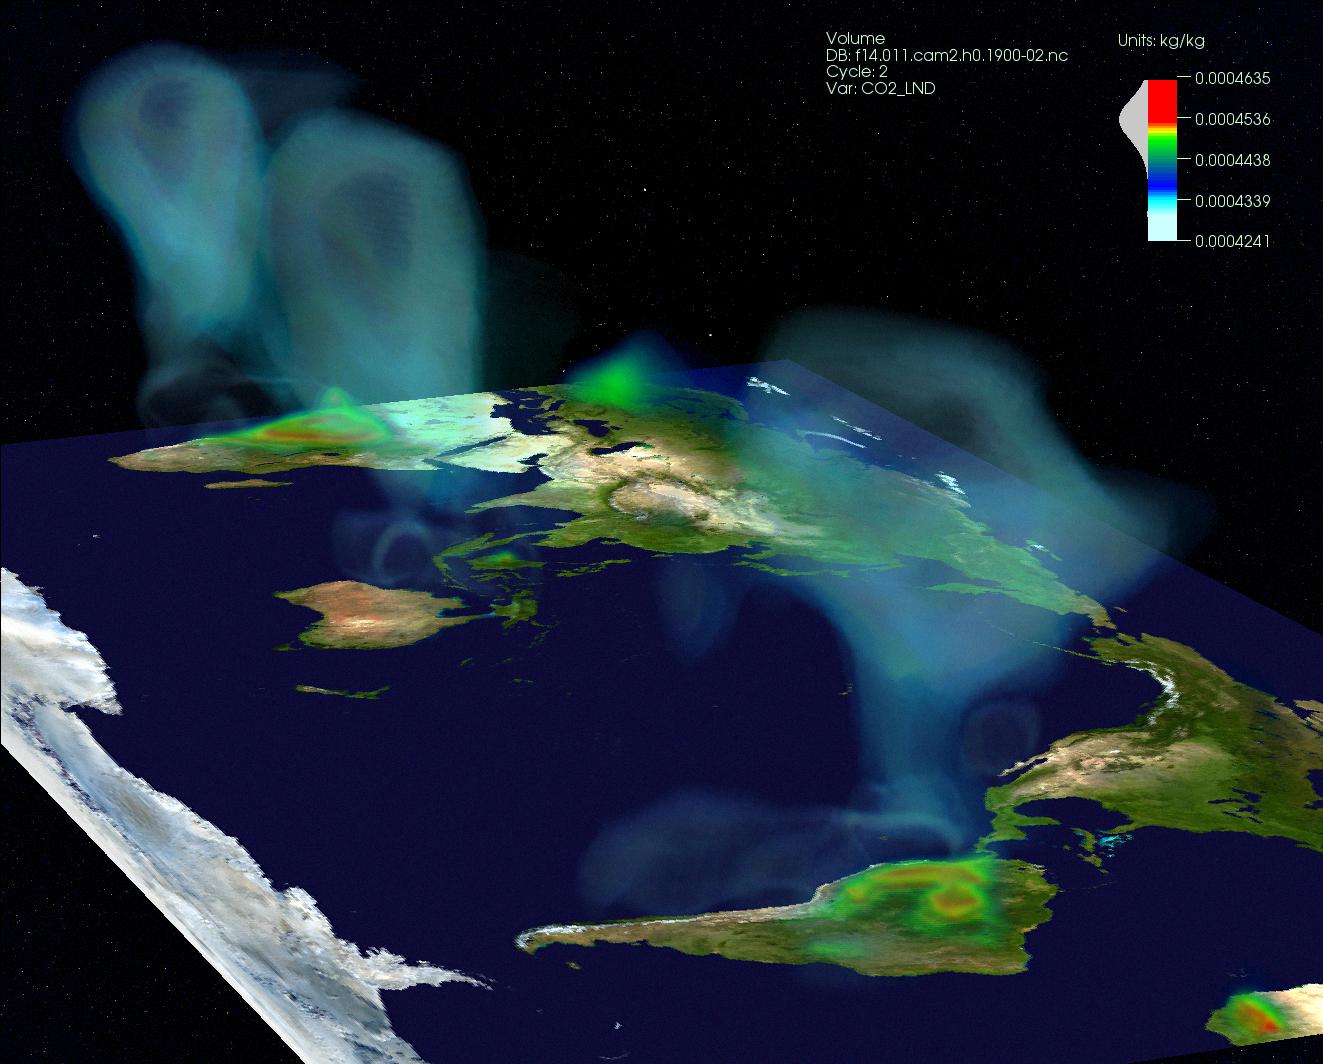
This visualization depicts the carbon dioxide from various sources that are advected individually as tracers in the atmosphere model. Carbon dioxide from the land is shown as plumes during February 1900.
| Image | Image(s) courtesy of Forrest Hoffman and Jamison Daniel of ORNL |
Previous Post in EXAMPLES Back to EXAMPLES Next Post in EXAMPLES