Image Annotations
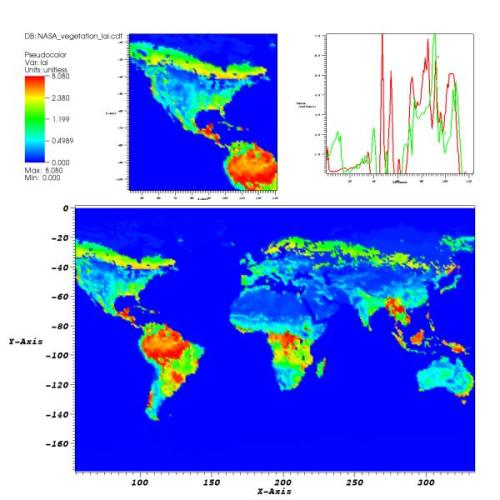
The featured plot shows Leaf Area Index (LAI), a measure of global vegetative matter, from a NetCDF dataset. The primary plot is the large plot at the bottom, which shows the LAI for the whole world. The plots on top are actually annotations that contain images that VisIt generated earlier. Image annotations can be used to include material that enhances a visualization such as auxiliary plots, images of experimental data, project logos, etc.
| Data | Data courtesy of NASA |
Previous Post in EXAMPLES Back to EXAMPLES Next Post in EXAMPLES